Best AI Tools for Creating Data Presentations in 2026
Data analysts spend hours building presentations that explain their findings. The analysis takes 2 hours. The slides take 3. That ratio is wrong — and AI is fixing it. Here's what actually works in 2026.
Most analysts are strong at finding insights but weak at presenting them visually. The default approach is to open PowerPoint, stare at a blank slide, and spend too much time on formatting instead of content.
AI tools don't just speed this up — they change the workflow entirely. You describe what you want, and the slide appears. The formatting is done for you. All that's left is the thinking.
Gamma is the fastest way to go from data findings to a presentable deck. You type your key points in plain text, and Gamma generates a complete, well-designed presentation in seconds.
What makes it different from PowerPoint is that Gamma treats content as the primary input — not slide layout. You think about what you want to say, not where to put the text box.
Real example:
I had a set of findings from a customer churn analysis — five key points, three supporting charts. I typed them into Gamma as bullet points and selected a professional theme. In about 90 seconds I had a 12-slide deck with consistent formatting, icons, and layout. I spent the remaining time adjusting the wording, not fighting with alignment.
Verdict: If you need a presentation ready in under 30 minutes, Gamma is the tool. It removes the formatting bottleneck completely.
Tool 2 — Claude (Best for Writing the Narrative)
Gamma handles the design. Claude handles the words. Before I build any presentation, I use Claude to turn my raw findings into a structured narrative.
The prompt I use every time: "I have these data findings: [paste findings]. Help me structure them into a 10-slide presentation for senior management. Each slide should have one key message and two to three supporting points. Focus on business impact."
Real example:
I had 15 bullet points from a sales analysis. I pasted them into Claude and asked it to structure a presentation. It came back with a clear arc — problem, findings, root cause, recommendation, next steps. I copied the structure into Gamma, adjusted two slides, and had a finished deck in 20 minutes.
Verdict: Use Claude to write the story, Gamma to build the slides. Together they replace two hours of work with twenty minutes.
Tool 3 — Julius AI (Best for Chart Generation)
Every good data presentation needs charts. Julius AI lets you upload your dataset and generate charts in plain English — no Excel formulas, no Tableau calculated fields.
"Show me a bar chart of revenue by region for Q1 2026, sorted from highest to lowest." Done in 15 seconds. Copy the chart into your Gamma presentation.
ANALYST PROMPT — COPY & PASTE INTO JULIUS AI
TASK: Show monthly churn rate trend for a B2B SaaS company
DATA: Connect your CSV or database — columns needed: Month, Churn_Rate_Pct
OUTPUT: Clean line chart with danger threshold and color-coded areas
FLAG: Highlight months where churn rate exceeds 5% threshold
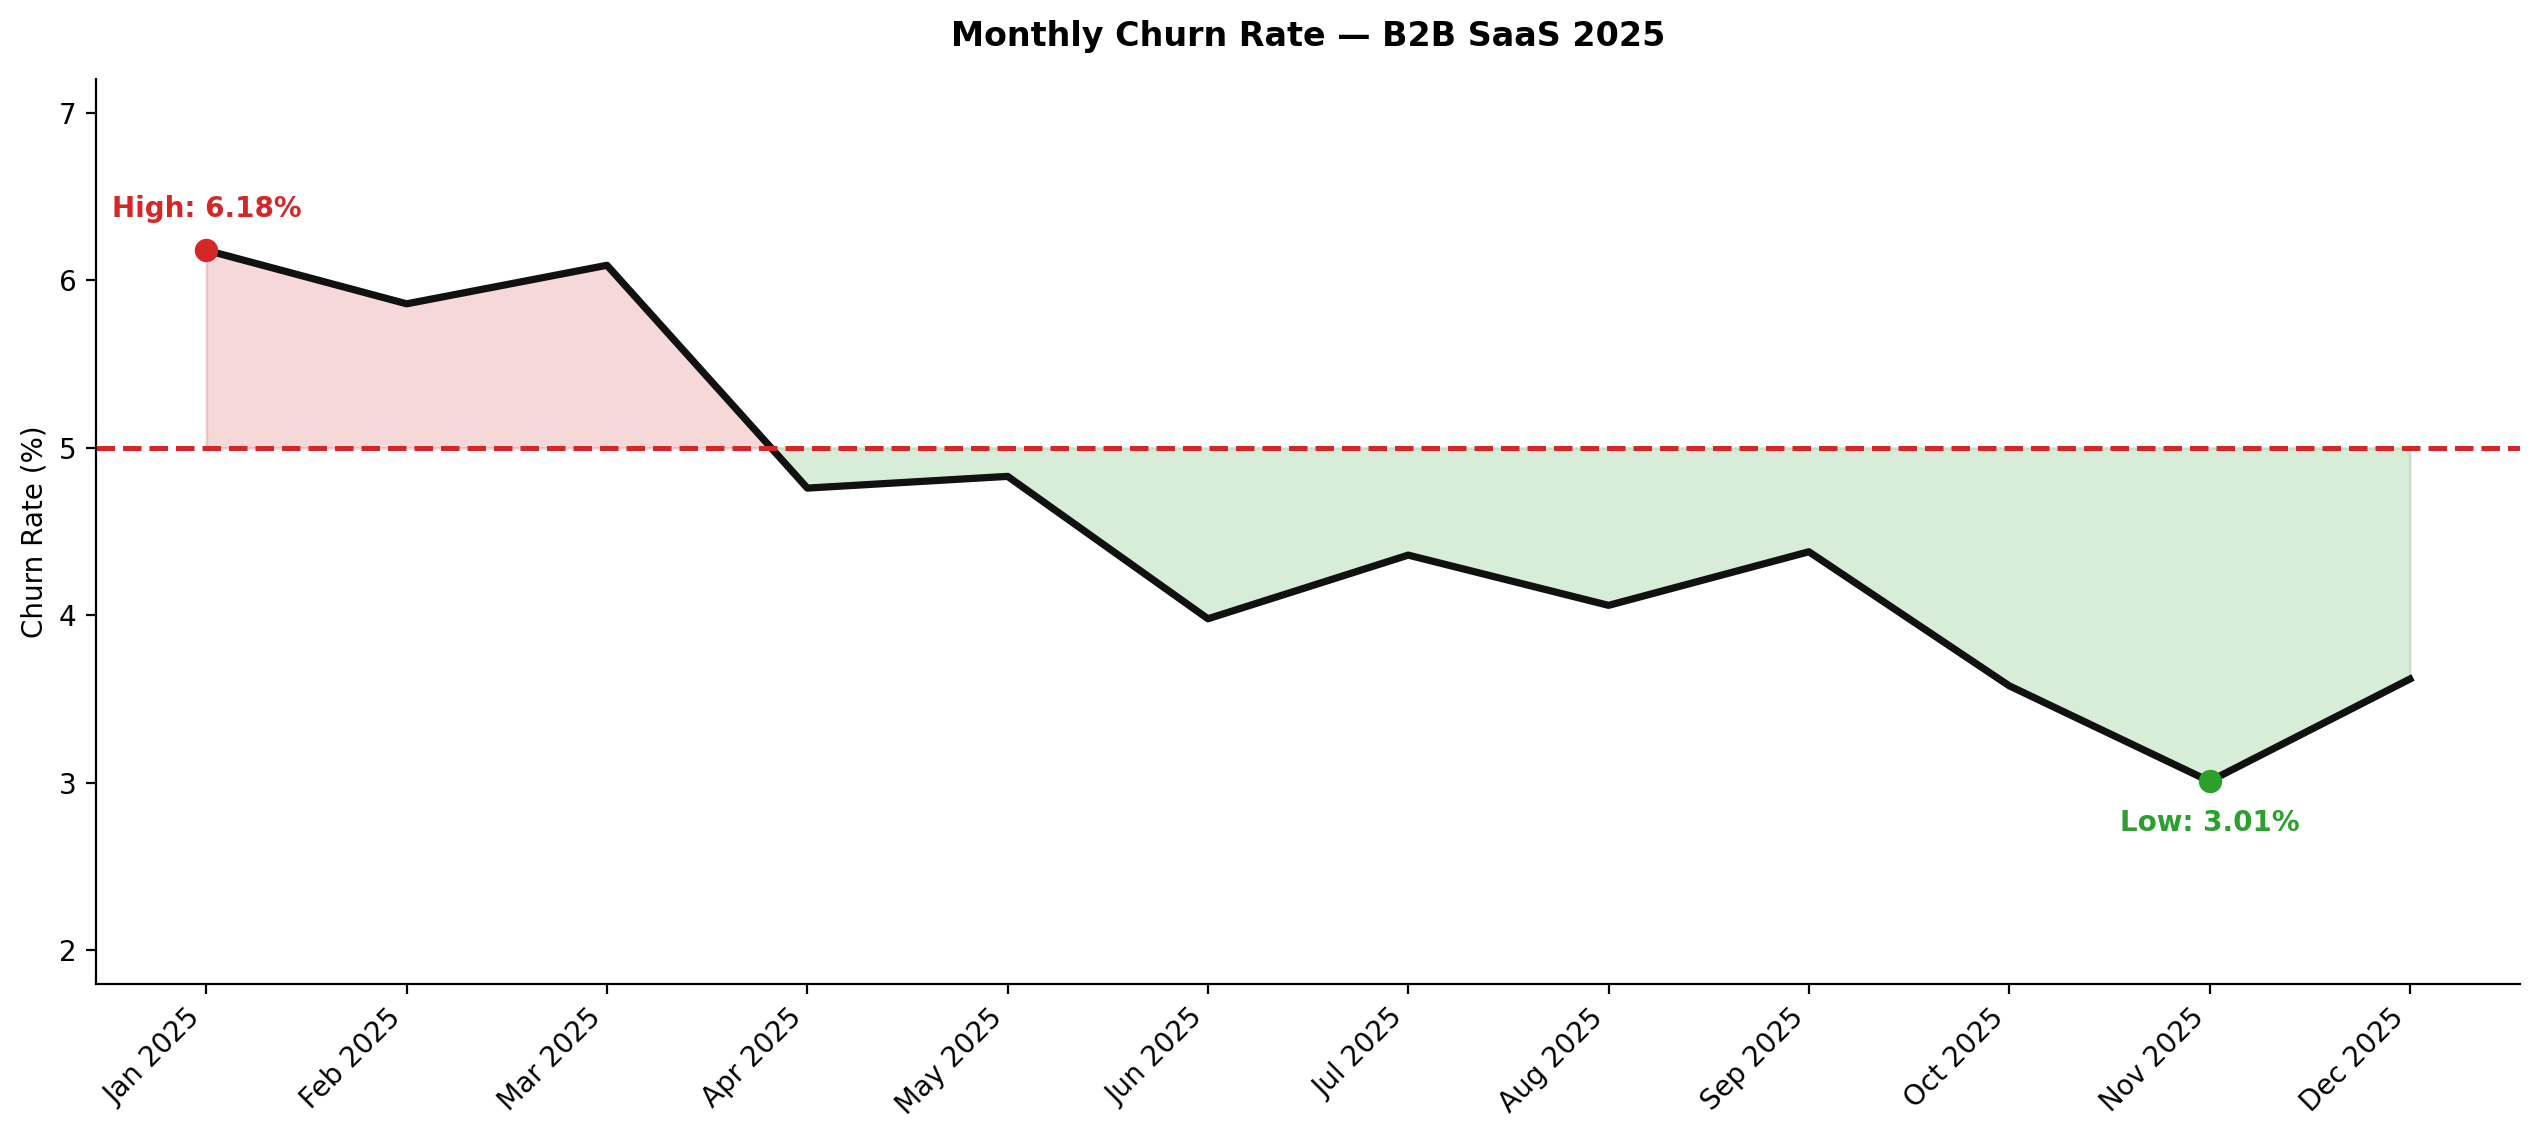
3. VISUALIZATION — Single line chart · red dashed line at 5% threshold · fill red above threshold, green below · label only highest and lowest points · title: "Monthly Churn Rate — B2B SaaS 2025"
4. INSIGHT — Worst and best months · overall trend · one recommendation · max 2 sentences
Result: Generated in under 15 seconds — Julius AI identified January and March as danger months (above 5% threshold), with a clear improvement trend through the year.
Red area = churn above 5% danger threshold. Green area = healthy churn range. High point labeled at 6.18% (Jan), low point at 3.01% (Nov). No formulas, no drag and drop.
Verdict: Julius AI is the fastest way to generate presentation-ready charts from raw data. Use it before opening Gamma.
Once your presentation is ready, you still need to share it. If you're emailing the same deck to the same people every month, automate it. GetResponse lets you schedule presentation emails automatically — set it up once and it runs itself.
What is the best AI tool for creating data charts for presentations?
Julius AI is the best tool for data analysts who need presentation-ready charts fast. Upload your dataset, describe the chart in plain English, and it generates it in under 15 seconds — no Excel formulas, no Tableau. Try Julius AI free — Turn raw data into charts in seconds
How long does it take to build a data presentation with AI?
With the Claude + Julius AI + Gamma workflow, a professional 10-12 slide deck takes 20-30 minutes from findings to finished deck. Without AI, the same deck typically takes 3-4 hours.
Is Gamma better than PowerPoint for data presentations?
For most analysts, yes. Gamma generates a complete, well-formatted deck from bullet points in seconds. PowerPoint gives more control but requires significantly more time on formatting. If you need a deck fast and don't need pixel-perfect control, Gamma wins.
How do I automate sending presentations to stakeholders?