5 Ways Data Analysts Can Save 10 Hours a Week with AI
I track my work hours. After introducing AI into my workflow, I recovered an average of 11 hours per week — without working faster or cutting corners. Here's exactly what changed.
Writing complex queries used to be the biggest time sink in my day. Joins, window functions, subqueries — every query took 20-40 minutes to write and debug.
Now I describe what I need in plain English and let Claude write the first draft.
Real example:
I typed: "Write a SQL query that shows the top 10 customers by revenue in the last 90 days, excluding customers who churned, grouped by region."
Claude returned a working query in 8 seconds. I reviewed it, made one small adjustment, and ran it. Total time: 3 minutes instead of 35.
Time saved: 2-3 hours per week for analysts who write queries daily.
2. Automate Your Weekly Reports
If you're sending the same report every week, you're wasting time. Every. Single. Week.
The fix is simple: build the report once, automate the delivery. I use GetResponse to schedule reports to go out automatically every Monday morning. My stakeholders get their update, I don't touch anything.
Real example:
I had a weekly KPI email I sent to 6 managers every Monday. It took me 45 minutes to compile and format. I set up an automated version in GetResponse once — took about 90 minutes. Now it sends itself. I've saved over 30 hours in the past two months alone.
Time saved: 1-3 hours per week depending on how many recurring reports you send.
3. Use AI to Explain Your Findings to Non-Technical Stakeholders
The hardest part of being a data analyst isn't finding insights — it's explaining them to people who don't speak data.
I used to spend an hour rewriting technical summaries into business language. Now I paste my findings into Claude with one instruction: "Rewrite this for a VP who doesn't have a data background. Focus on business impact and recommended actions."
Real example:
My finding: "Cohort analysis shows 30-day retention dropped 12% MoM for users acquired via paid social, while organic cohorts remained stable at 68%."
Claude's version: "Customers we're paying to acquire are leaving faster than before — but customers who find us on their own are staying. This suggests our paid ads may be attracting the wrong audience."
Same insight. One version gets acted on. The other gets filed.
Time saved: 1-2 hours per week on report writing and stakeholder communication.
4. Research in Minutes, Not Hours
Before any new project, I used to spend 2-3 hours reading industry reports, finding benchmarks, and understanding the business context. It was necessary but exhausting.
Now I open Perplexity and ask specific questions with sources. "What is the average customer acquisition cost in B2B SaaS in 2026?" returns cited, current answers in seconds.
Real example:
Before a retail client project, I asked Perplexity: "What are the key performance benchmarks for e-commerce conversion rates in 2026 by traffic source?" I got a sourced summary in 40 seconds that would have taken me 2 hours to compile manually. I walked into the kickoff meeting looking like I'd done deep research. I had — just in 10 minutes instead of 2 hours.
Time saved: 1-2 hours per new project or research task.
5. Turn Raw Data into Charts Instantly
Visualization is one of the most time-consuming parts of the job — and one of the easiest to accelerate with AI.
Julius AI lets you upload a dataset and describe the chart you want in plain English. No more fighting with Excel formatting or Tableau calculated fields for simple requests.
Real example:
I uploaded a CSV with 6 months of sales data and typed: "Show me a line chart of weekly revenue with a 4-week moving average, and highlight the weeks where revenue dropped more than 10% week-over-week."
It generated the chart in about 15 seconds. In Tableau, that would have taken me 25 minutes.
Time saved: 2-3 hours per week for analysts who build visualizations regularly.
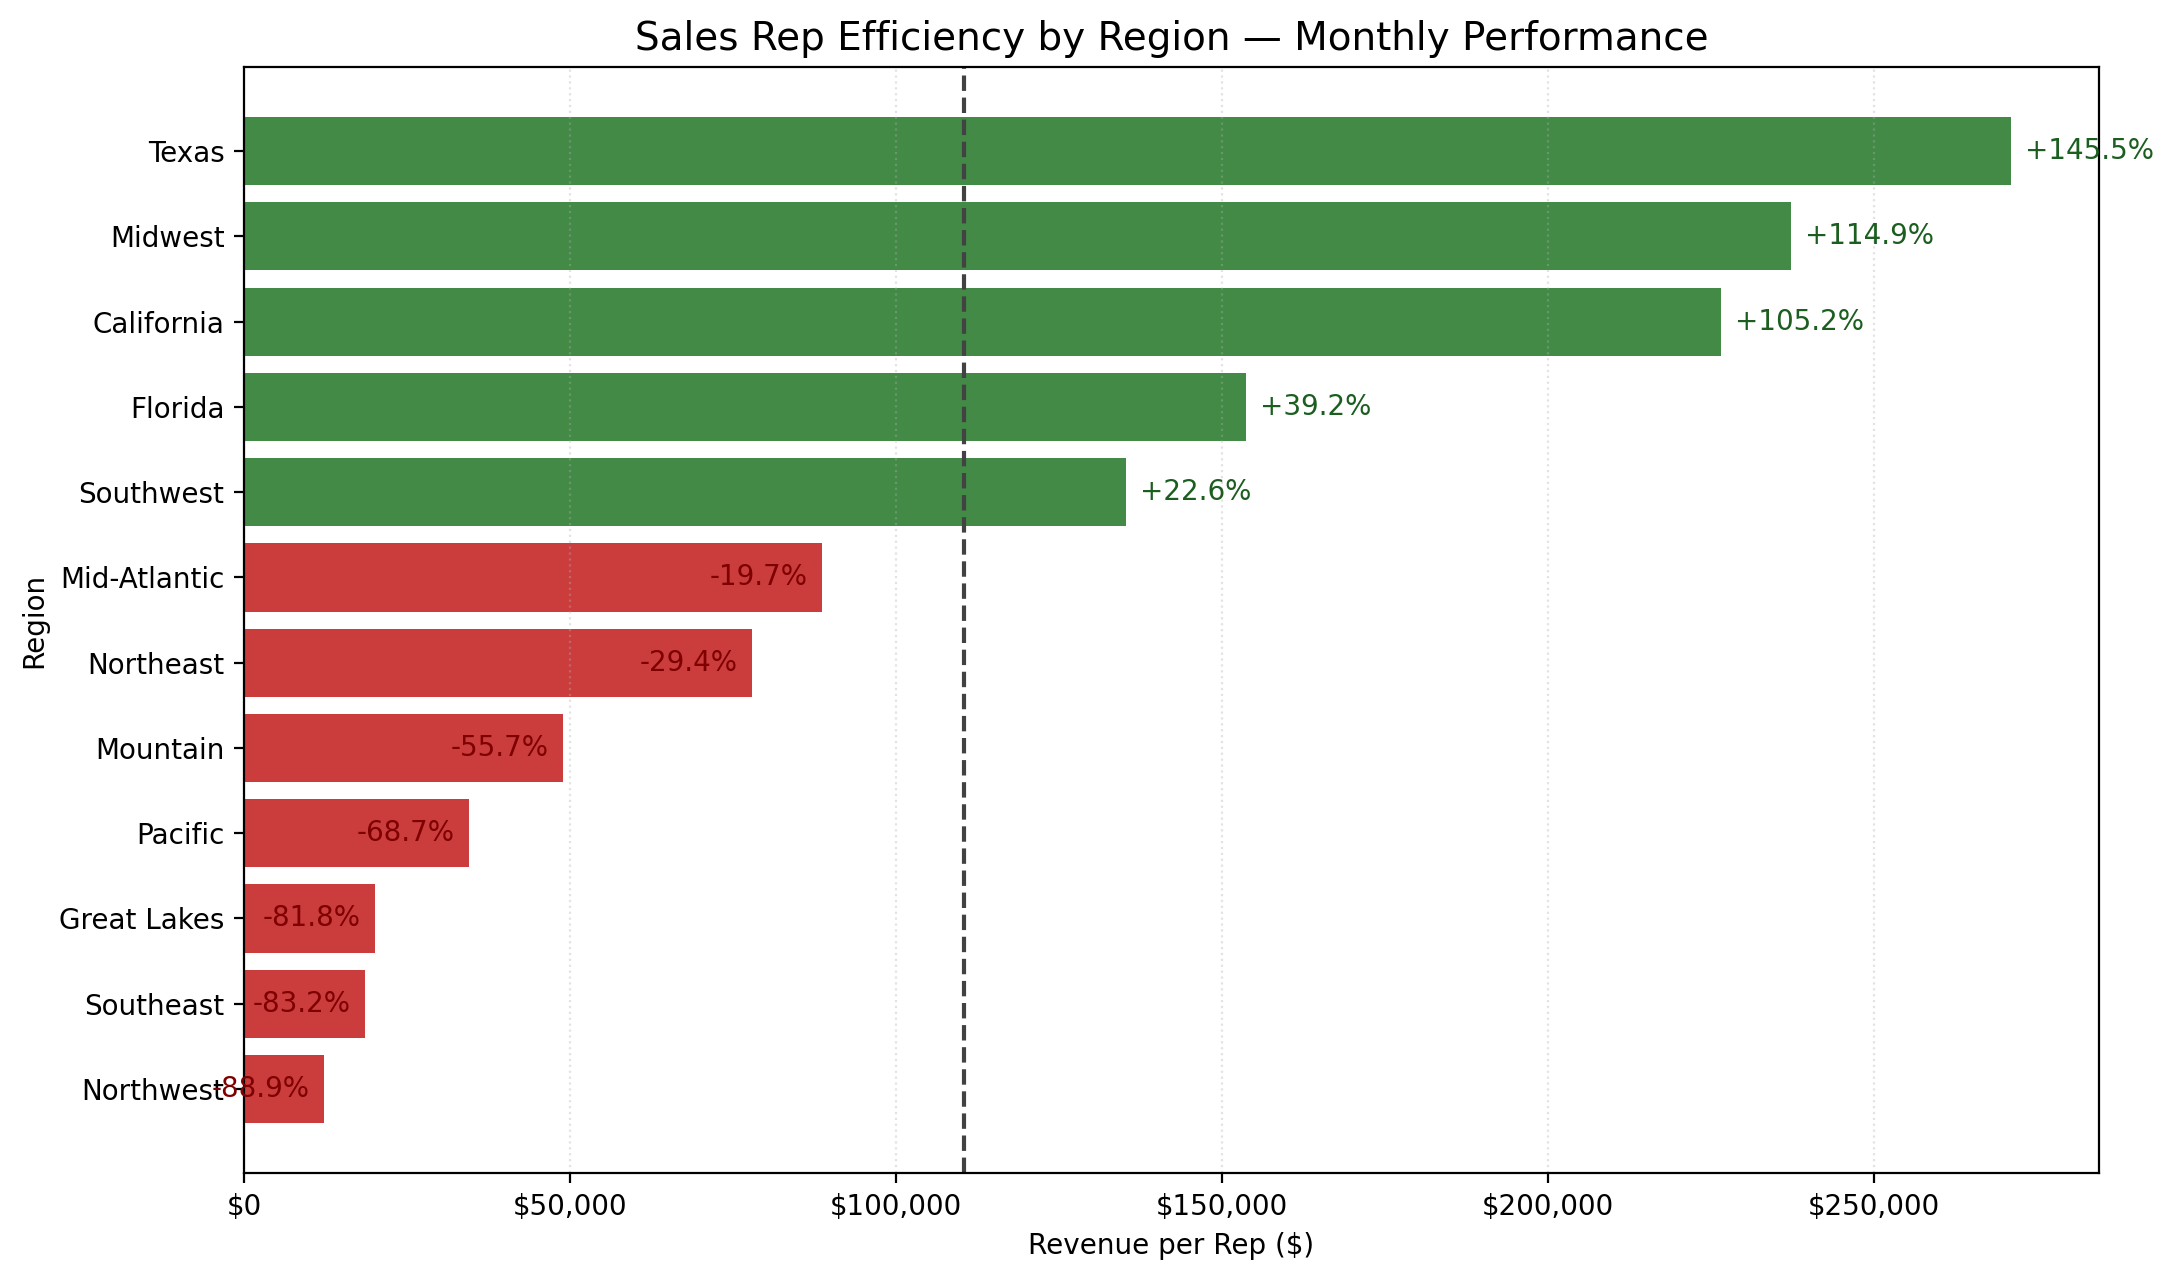
ANALYST PROMPT — COPY & PASTE INTO JULIUS AI
TASK: Identify performance outliers across sales regions
DATA: Connect your CSV or database — columns needed: Region, Monthly_Revenue, Target, Rep_Count
OUTPUT: Horizontal bar chart showing revenue per rep with outlier highlighting
FLAG: Mark regions where revenue per rep is more than 15% below the regional average
1. DATASET — 12 sales regions · Revenue_Per_Rep calculated · at least 3 regions significantly underperforming
2. CALCULATION — Revenue_Per_Rep per region · Performance_Gap % vs average · rank all regions
3. VISUALIZATION — Horizontal bars (green=above average, red=below) · dashed average line · gap % labels · title: "Sales Rep Efficiency by Region"
4. INSIGHT — Top 3 and bottom 3 regions · average revenue per rep · one recommendation · max 3 bullet points
Result: Generated in under 15 seconds — Julius AI identified Texas, Midwest and California as top performers, while Northwest, Southeast and Great Lakes need immediate attention.
Green bars = above average revenue per rep. Red bars = underperforming regions. Dashed line = company average. No formulas, no drag and drop.
Automated reports with GetResponse: 1-3 hours saved
Stakeholder communication with Claude: 1-2 hours saved
Research with Perplexity: 1-2 hours saved
Visualizations with Julius AI: 2-3 hours saved
Total: 7-13 hours per week, depending on your role and workload.
You don't have to implement all five at once. Pick the one that matches your biggest time drain this week. Add the next one next week. In a month, your workflow will look completely different.
Julius AI is purpose-built for data analysts. Upload your CSV or connect your database, describe the chart you want in plain English, and it generates it in seconds. No formulas, no drag and drop. Try Julius AI free — Turn raw data into charts in seconds
Can AI really save 10 hours a week for data analysts?
Yes — but only if you use the right tools for the right tasks. The biggest time savings come from automating report delivery (GetResponse), generating charts instantly (Julius AI), and using Claude for SQL writing and stakeholder communication. Together these five methods recover 7-13 hours per week.